How to track Claude Code usage and cost by project
Claude Code tells you what a run cost when it ends. This guide shows how to keep that number, attach it to the right project and client, and read it in charts, in about five minutes.
What you will set up
By the end of this guide, every Claude Code run you start from Pandore will be recorded with its tokens, its reported cost, and the project, client, agent and model behind it. You will also have a budget that warns you before a project overspends.
You need Pandore (free, for Mac and Windows) and a working Claude Code account. If Claude Code is not installed yet, Pandore can install it for you.
Step 1: Connect Claude Code
- Open Pandore, then Settings › AI.
- Choose Claude Code as the remote agent. If it is missing, install it from the same screen.
- Check that the status shows it as ready.
Pandore uses your existing Claude Code login. There is nothing to paste and no API key to create.
Step 2: Run an agent inside a project
Usage is only useful when it is attached to something. Start from a project:
- Open a project, or create one and link it to its folder on disk.
- Go to the project's Agents tab and pick an agent, for example Reviewer.
- Add instructions if you want, then click Run.
The agent works directly in the project folder. When the run ends, Pandore stores what Claude Code reported: input, output, cache read and cache write tokens, and the cost.
Step 3: Open the AI usage dashboard
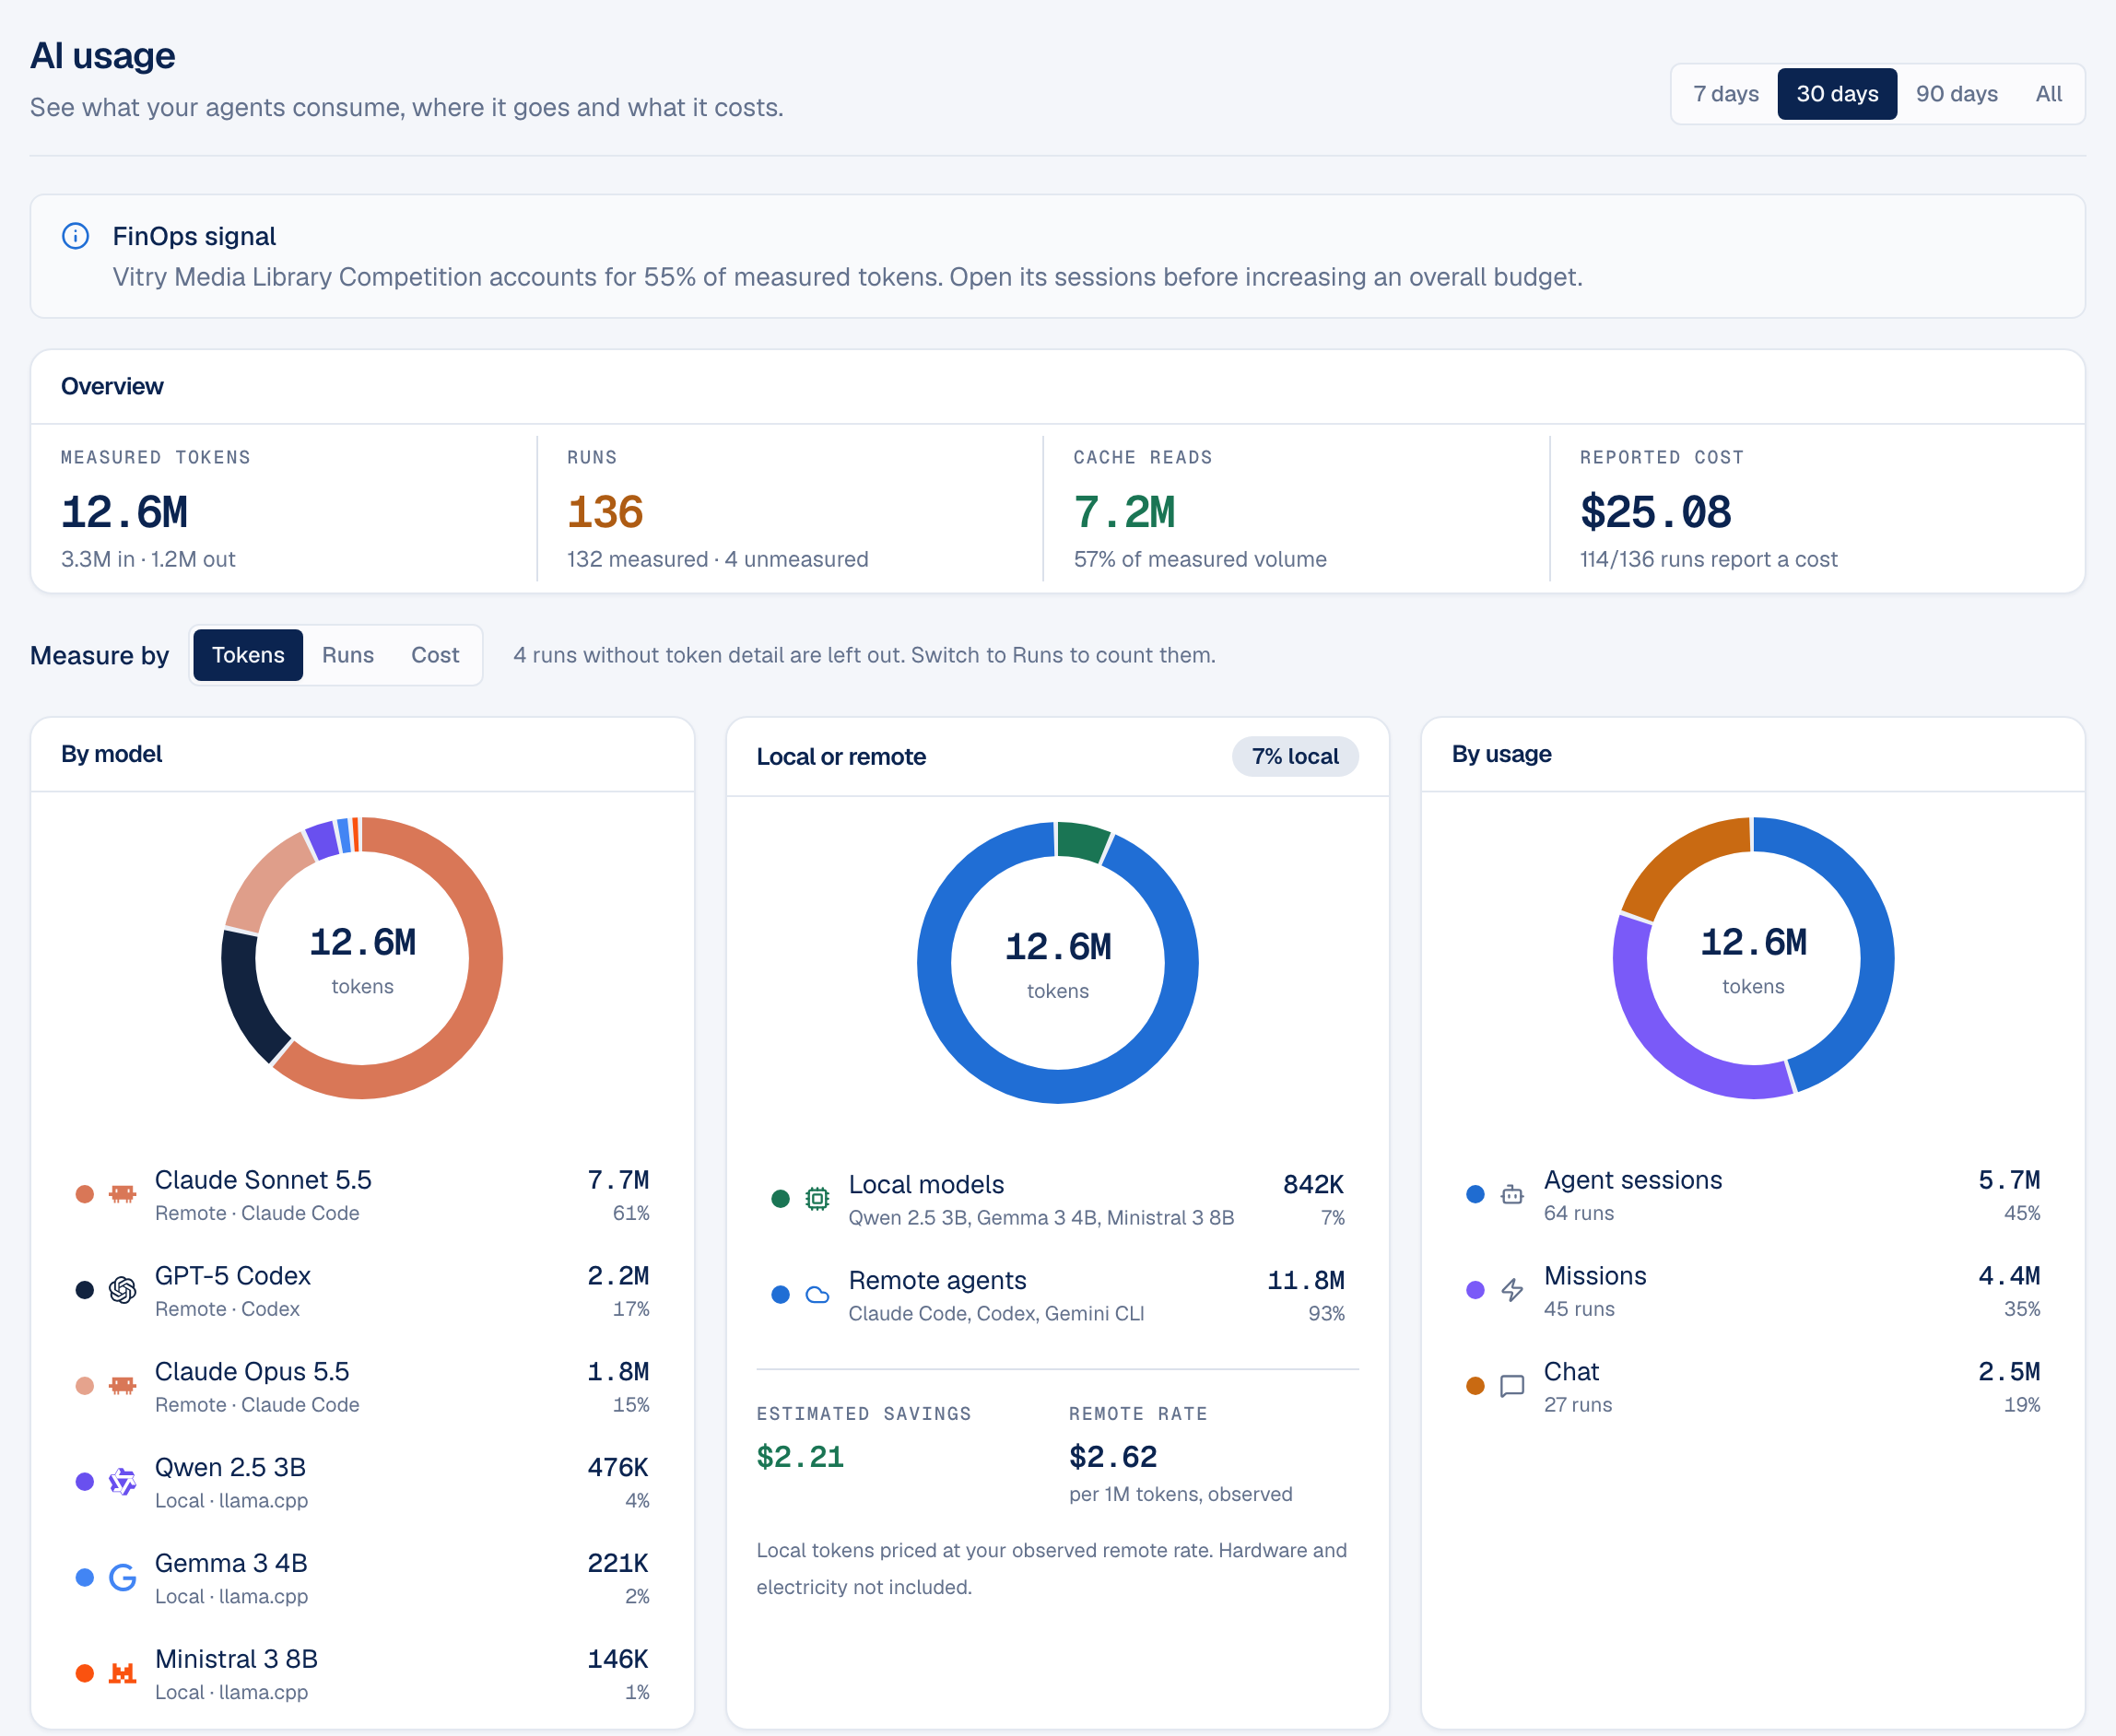
Click AI usage in the sidebar. The page has four parts:
- Overview: measured tokens, runs, cache reads and reported cost for the period.
- By model, Local or remote, By usage: three donut charts. Hover a slice to see its value in the center.
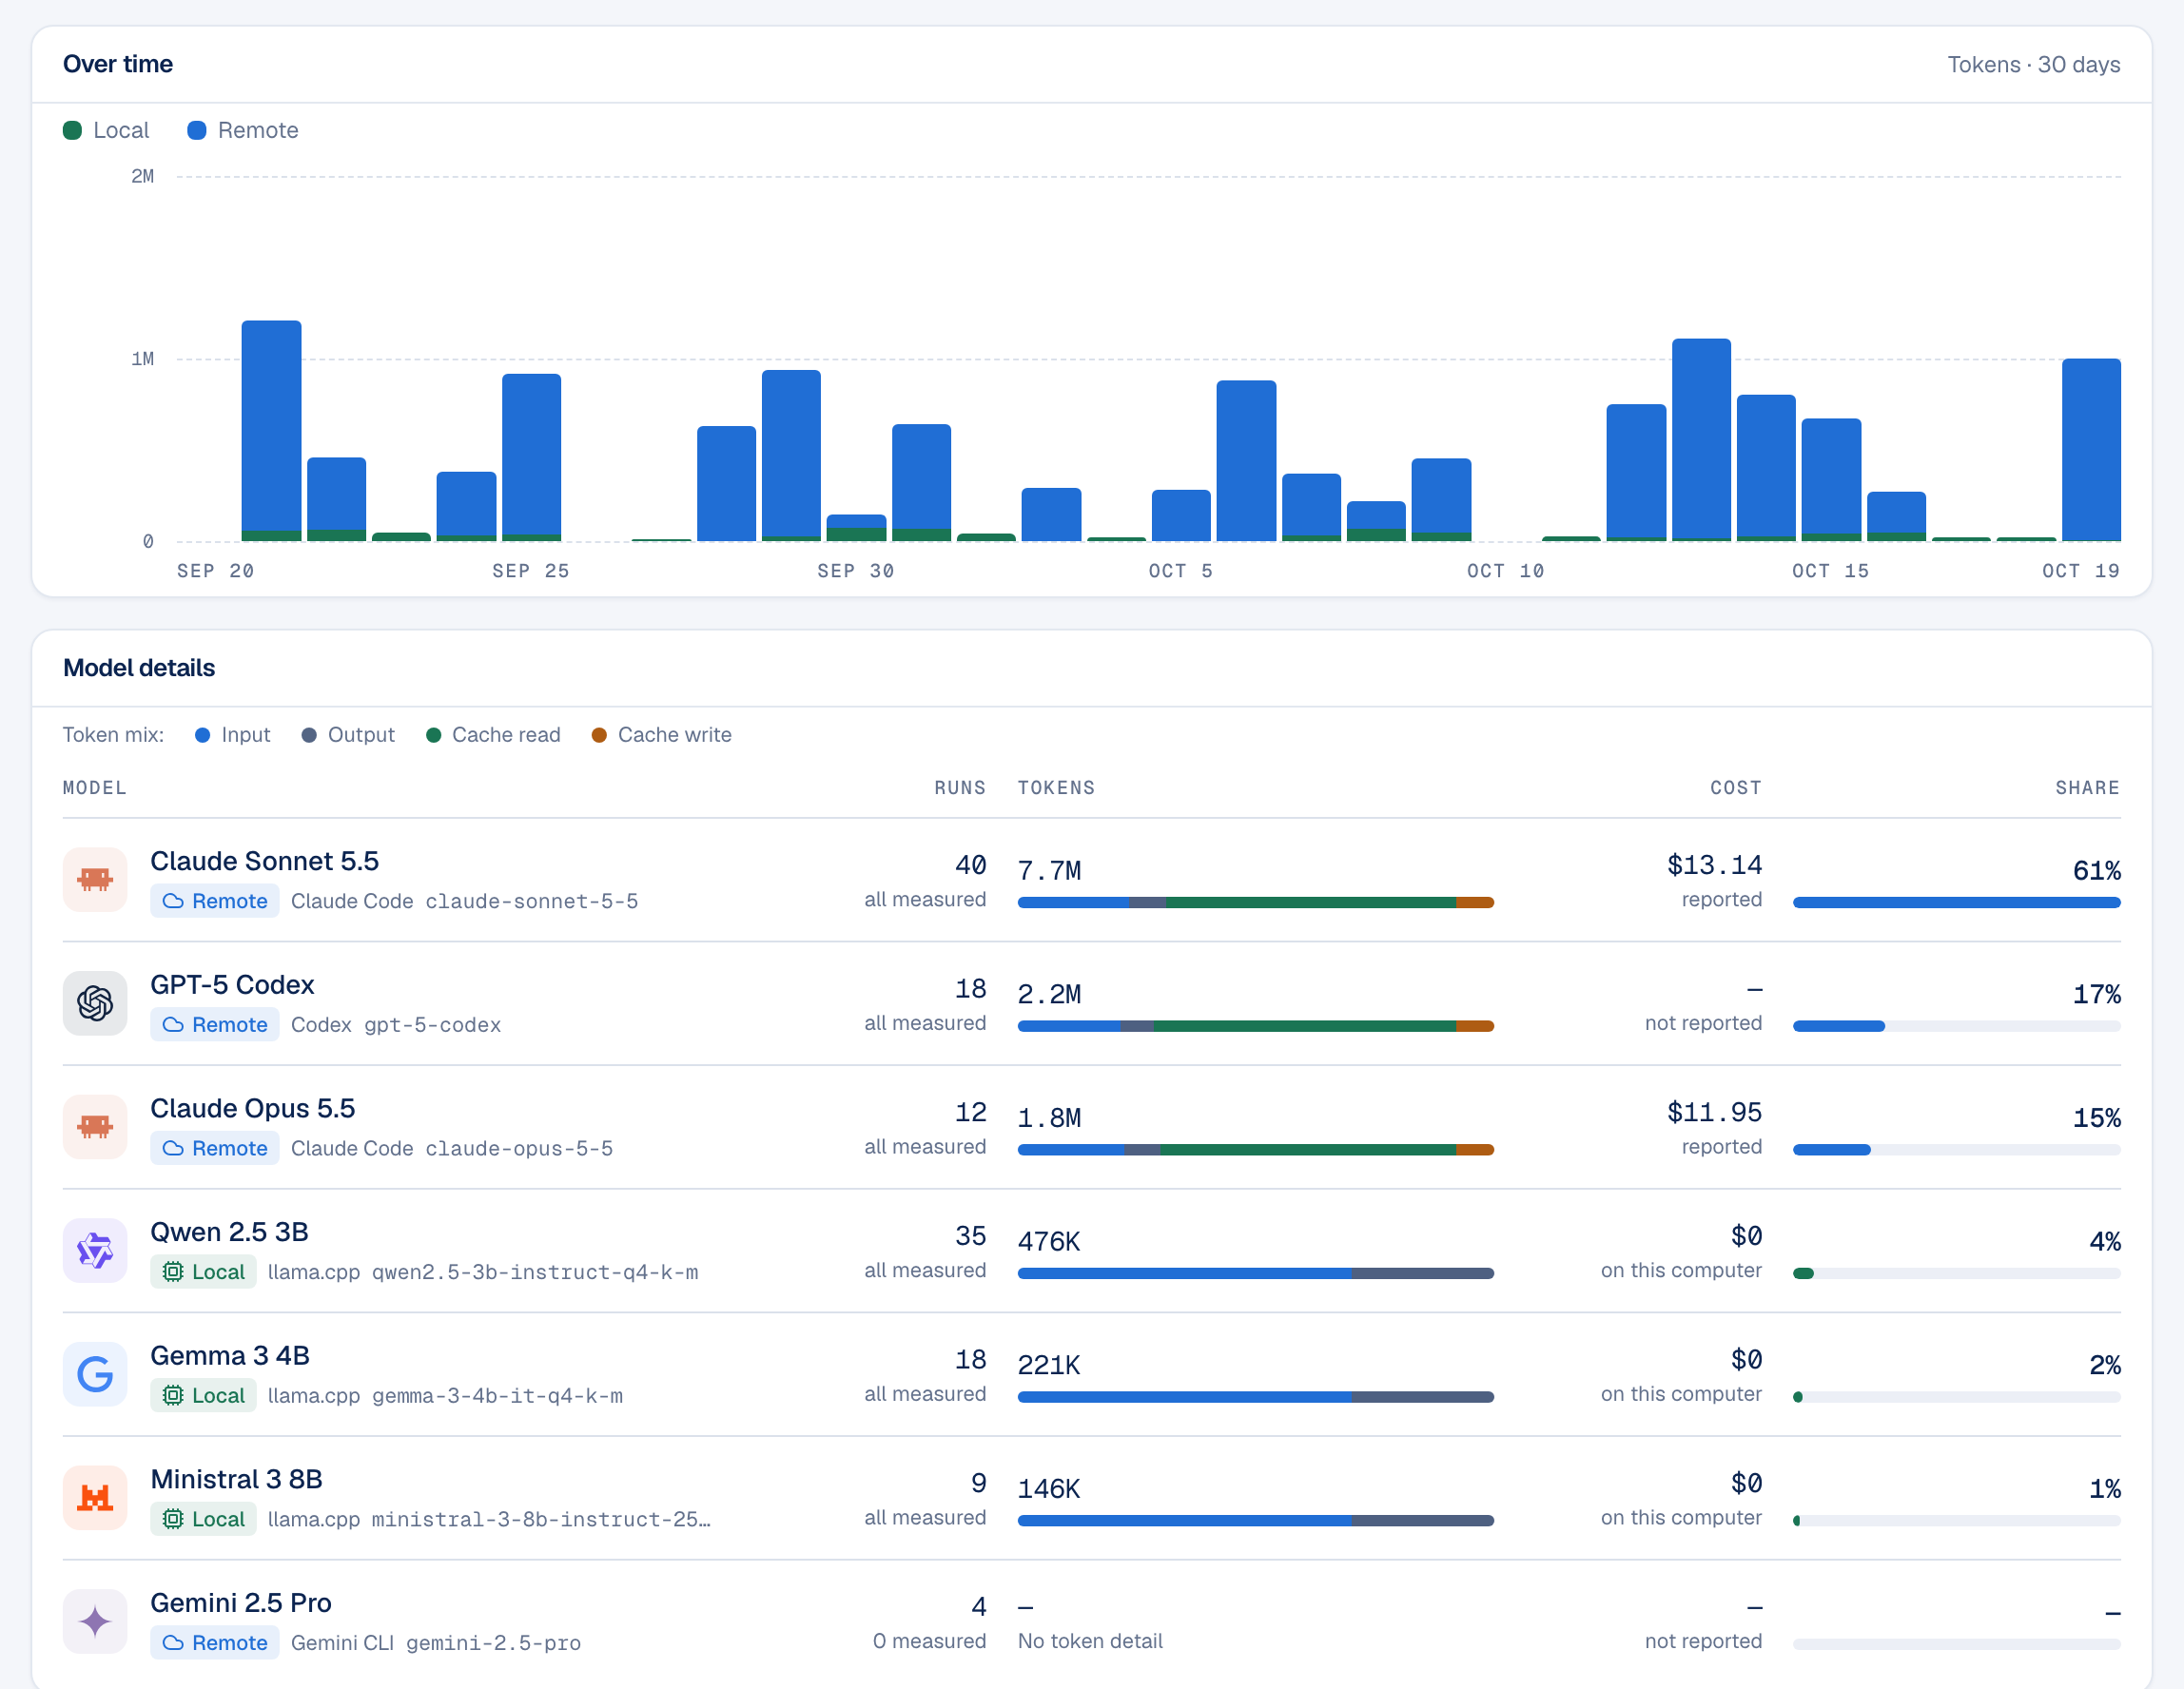
- Over time: a day-by-day chart, split between local and remote work.
- Model details: each model with its exact identifier, its runs, its token mix and its reported cost.
Use the period switch at the top (7 days, 30 days, 90 days, All) and the Measure by switch to count in tokens, runs or cost.
Step 4: Find what costs the most
Three readings answer most questions:
- Switch Measure by to Cost. The By model chart now shows which model spends your money. Larger models cost more per token, so a few runs on a large model can outweigh many runs on a smaller one.
- Look at the token mix bar in Model details. A bar dominated by cache reads is cheap; a bar dominated by input means the agent receives a lot of new context on every call.
- Scroll to the project and client rankings. The FinOps signal at the top of the page also names the project that concentrates the most tokens.
Step 5: Set a budget
- Click Budgets at the top of the page.
- Set a token limit, a cost limit, or both, for the whole workspace, a client or a project.
- Choose the warning threshold, for example 80%.
Pandore flags a budget when usage nears the threshold and when it is exceeded. If you are not sure how to split a global budget, the suggested allocation follows each project's observed usage while keeping a share for quieter projects.